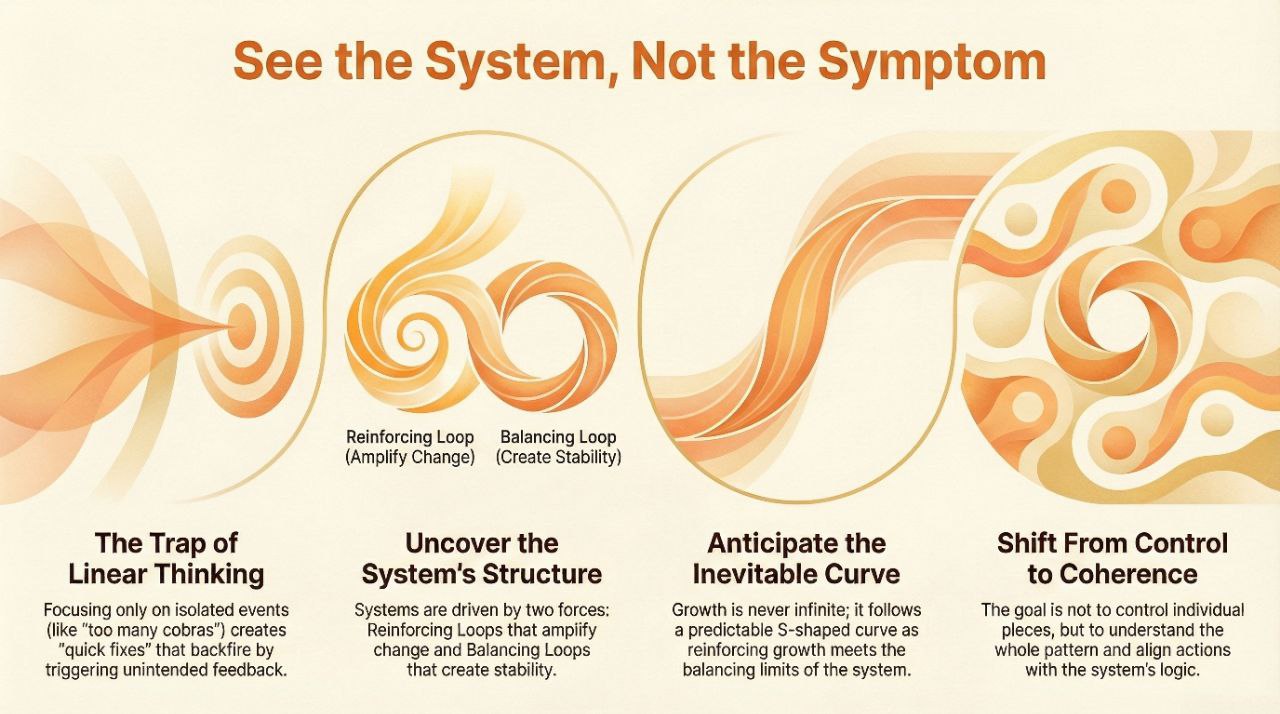
Introduction: The Cobra Effect and the Illusion of Control
In colonial India, the British government faced a deadly problem: the city of Delhi was overrun with venomous cobras. The officials proposed a solution that seemed perfectly logical, offering a cash bounty for every dead cobra brought in by residents. At first, the plan appeared to work. Fewer snakes roamed the streets and officials believed the threat was under control. Then a new incentive emerged. Some locals began breeding cobras to claim the rewards. When the government ended the program after discovering the scheme, the breeders released their now-worthless snakes and the cobra population soared beyond the level before the program began.
This is the “Cobra Effect,” a parable about the illusion of control that arises when simple fixes meet complex systems. We fail because we react to the event (too many cobras) instead of first seeing the underlying structure (the new economic incentive) that drives them. The world of a decision maker is full of Cobra Effects. Humans are trained to react, to fight fires and respond to crises while neglecting the unseen feedback loops that shape outcomes over time. This habit, known as event-level thinking, traps us in cycles of reaction.
The core question is: why do capable organizations keep designing their own failure loops? The answer lies in how they misunderstand feedback, treating complex interdependencies as simple cause and effect. Systems thinking begins where linear analysis ends. It asks not only what will happen if we act but how the structure of relationships will shape the result. This shift in perspective is like moving from watching a single chess piece to seeing the entire game.

From Linear Logic to System Logic
The first step in systems thinking is to stop looking at the parts and start looking at the connections. A Causal Loop Diagram (CLD) captures how cause and effect connect in circular patterns, revealing the structure behind a system. These connections form two kinds of feedback loops. Reinforcing loops drive acceleration while balancing loops create stability. When mapped, these loops become visible patterns of cause and effect. Each arrow represents a link labeled with a “+” or “–” to show whether the effect moves in the same or opposite direction.
Mapping these loops makes reasoning visible. By tracing links such as sales to hiring, hiring to costs and costs to profit, a leader moves from intuition to structure. The diagram becomes a mirror of the system’s logic, helping decision makers anticipate how their choices interact rather than merely react.
Systems thinking is the discipline of looking to a deeper level. It is about seeing the structure of the game, the reinforcing and balancing loops that quietly shape its outcome. Once you see that structure, you gain the ability to anticipate patterns of behavior, from the leveling off of a star product to the unintended consequences of an obvious quick fix.
The Dual Loops of Decision Systems
Nearly every system, from a marketplace to a political movement, is a combination of the two aforementioned loops. The strategist’s task is to identify which is dominant: is the system amplifying itself toward instability or restoring balance?
Reinforcing Loops (R): These are the engines of growth or collapse. A small change gets amplified, leading to more of the same.
Balancing Loops (B): These forces resist change and restore stability. They push back against change to keep a system near a target or goal.
The strategist must recognize which loops dominate and act before momentum turns to fragility. Consider Groupthink, where a team of smart people converges on a bad idea. This is a reinforcing loop that can trap a team. An initial suggestion is floated, a few influential people support it and the perceived consensus starts to build. This social proof makes others who are skeptical, the balancing force, stay silent. Their silence is then taken as agreement, which further reinforces the consensus. The snowball of bad judgment rolls faster and faster until it is too big to stop. Systems thinkers spot these loops early and intervene before feedback becomes collapse.
This is what happened to Blockbuster. In the early 2000s, the leadership team was trapped in a reinforcing loop of belief in their model. This consensus was so strong that social proof silenced internal warnings. The balancing signal, a small startup called Netflix, was dismissed as an irrelevant threat until collapse was inevitable.
Predicting Behavior with the Logistic Growth Equation
While Causal Loop Diagrams reveal structure, equations describe motion. The Logistic Growth Equation captures how a system expands within its natural limits:
Here, Xₜ is the current level, r the rate of growth and K the capacity limit. The term (1 - Xₜ/K) acts as a brake that slows expansion as the system nears its boundary.
At first, growth behaves exponentially. Each step builds on the last, creating the illusion of endless momentum. But as capacity fills, resources tighten, attention fades and regulation increases, the brake activates and the pattern bends into the familiar S-shaped curve.
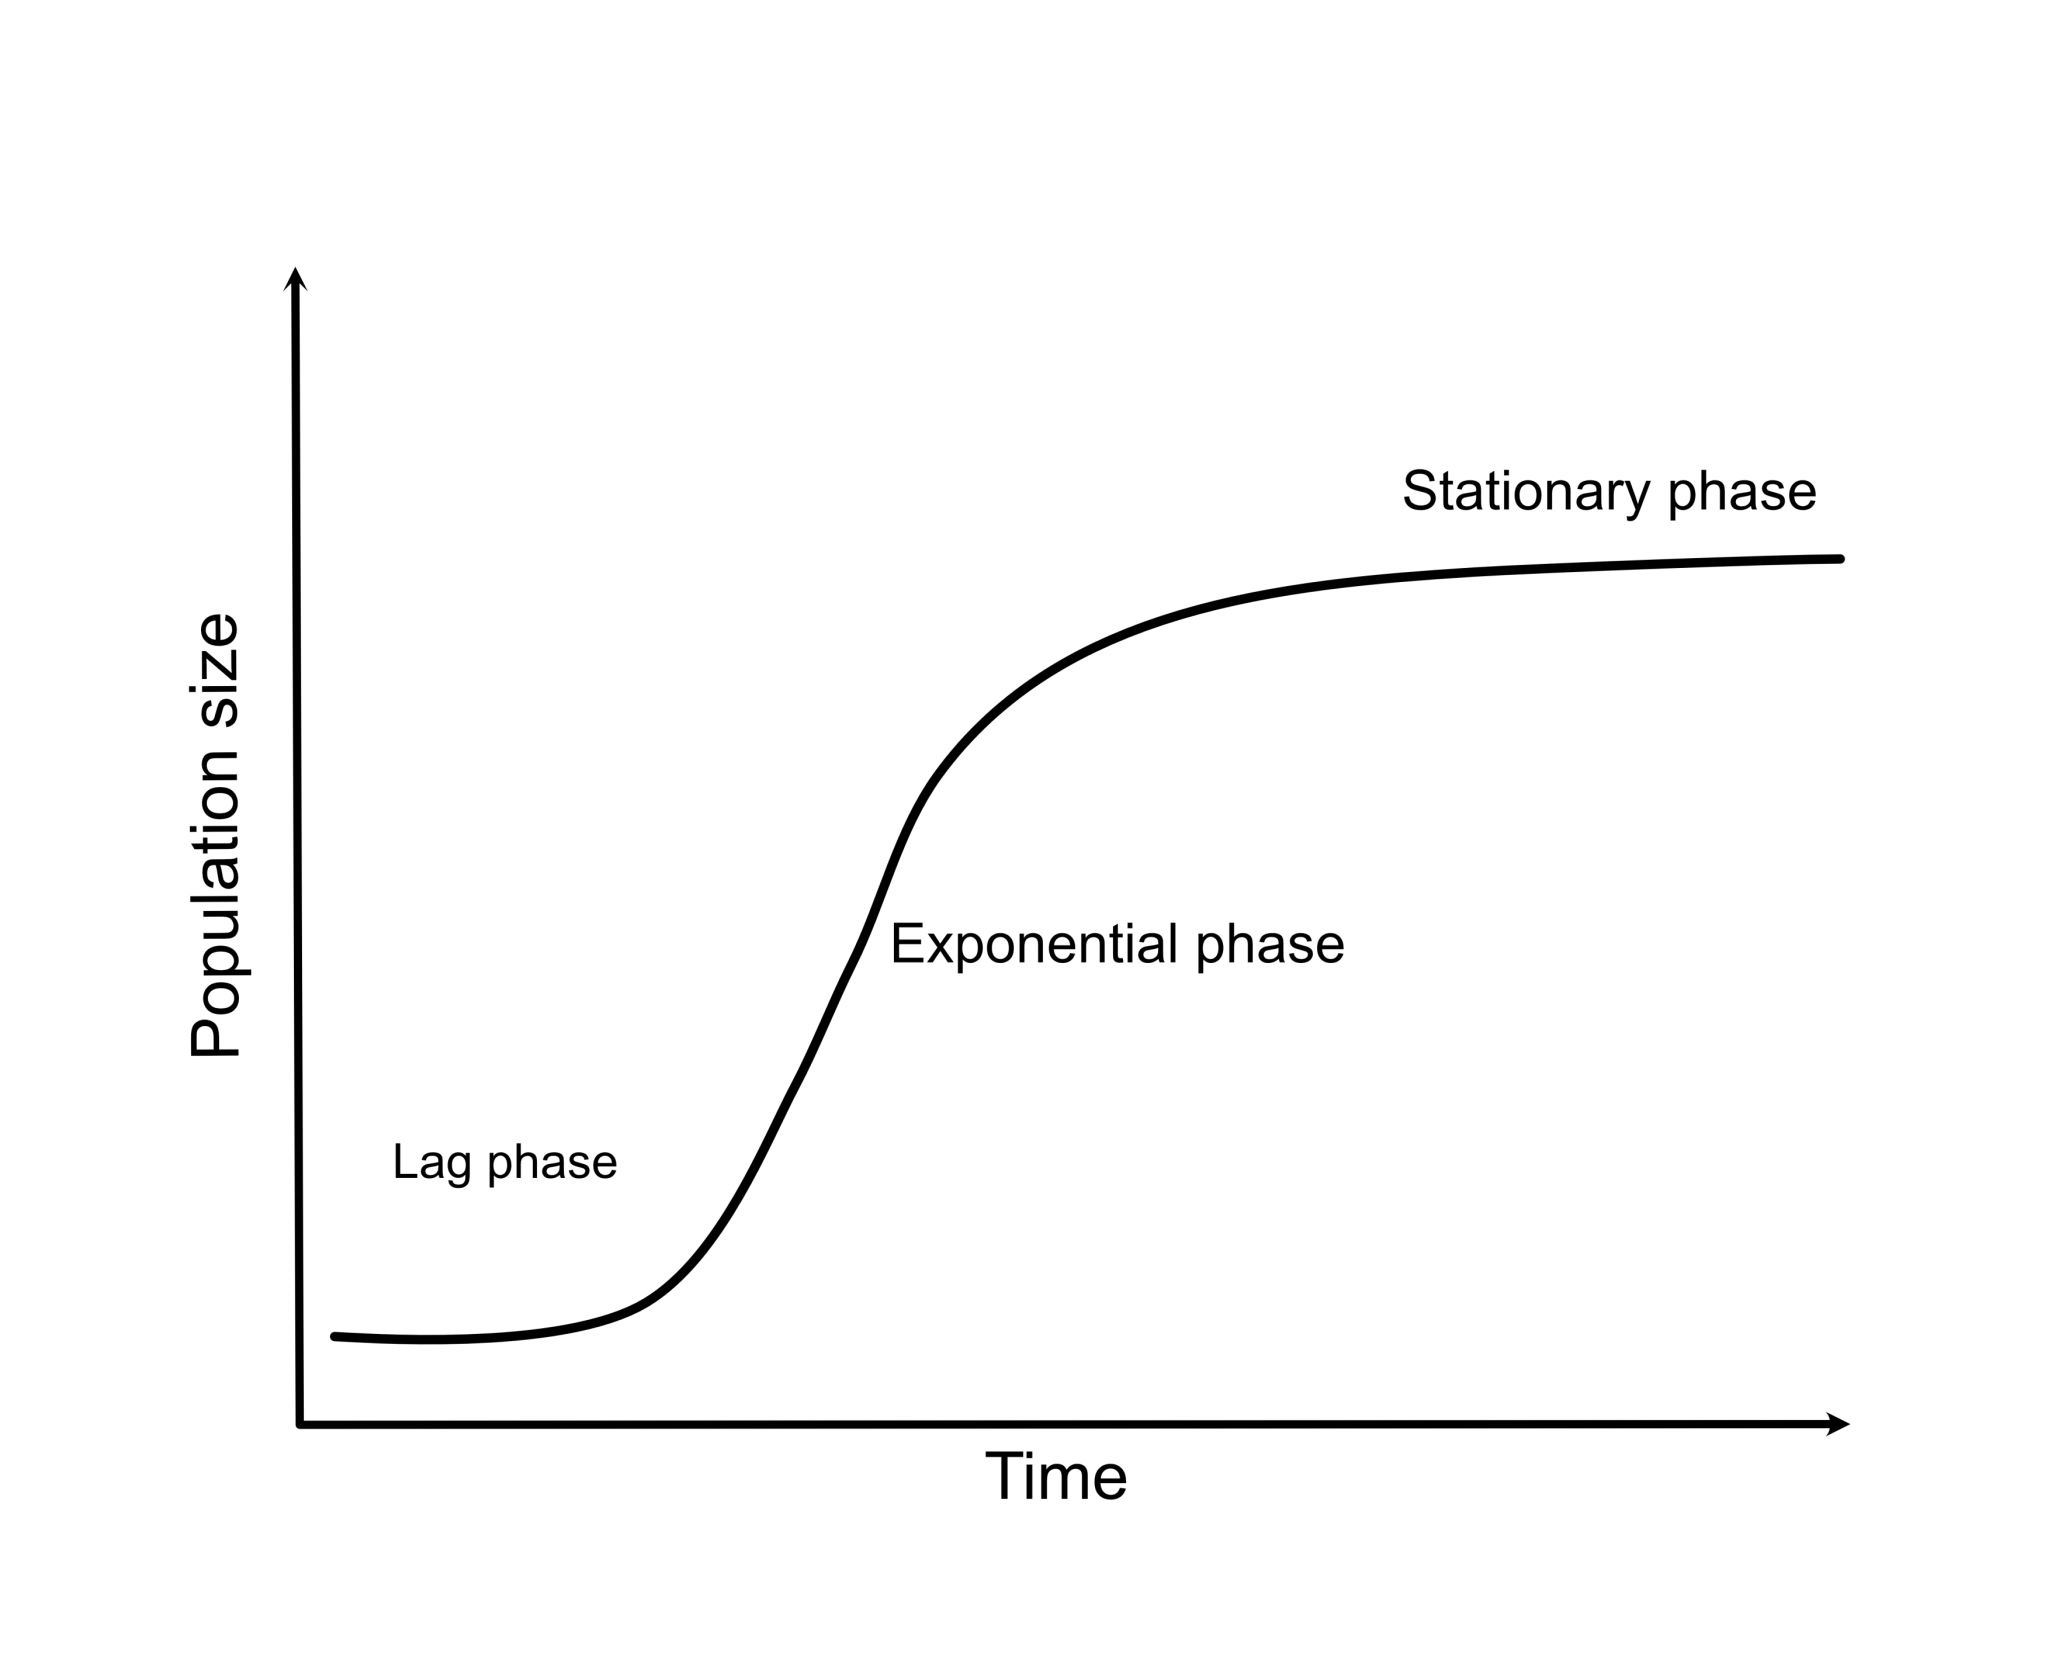
The classic pattern that emerges when an R meets a B is the S-shaped growth curve, also known as logistic growth. This pattern appears across industries. The logistic curve explains the three phases of smartphone adoption:
- Phase 1 (The Flat Start): In the mid-2000s, smartphones were a niche product for early adopters. Growth was slow as reinforcing loops such as word of mouth and app development were only beginning to build momentum.
- Phase 2 (The Steep Rise): From roughly 2007 to 2016, the reinforcing loop took over and adoption exploded. More users meant more apps, which attracted even more users and drove exponential growth.
- Phase 3 (The Flat Top): In recent years, growth has leveled off. The balancing loop of market saturation has taken hold; almost everyone who wants a smartphone now has one.
The Logistic Growth Equation is more than mathematics. This equation reminds leaders that every system carries its own limits. Markets saturate, institutions mature and enthusiasm fades. Leaders who understand this pattern prepare for the inflection point where growth slows, designing transitions before the system forces them.

Seeing the Whole Board
The Cobra Effect comes full circle here. The same pattern appears across industries. BlackBerry once dominated mobile communication but its success created cultural inertia that slowed adaptation to touchscreens and app ecosystems. IBM faced similar drag during its transition from hardware to services; the routines that built its strength became brakes on agility. These examples show how internal feedbacks such as bureaucracy, habits and risk aversion create natural ceilings on growth. It was never a failure of intelligence but of imagination, a blindness to how feedback loops evolve once human behavior adapts. True strategy means seeing the architecture of cause and effect before it reacts against you. Sustainable systems replace control with coherence, aligning incentives and information flows with the structures that govern them.
A Causal Loop Diagram explains why change happens. It reveals the architecture of feedback and the levers that amplify or contain movement.
The Logistic Growth Equation explains how change behaves over time. It traces the tempo, the acceleration, peak and plateau that every living system follows.
Together, they give decision makers a complete picture of system dynamics. The diagram shows the wiring of the system and the equation shows its rhythm. Those who think in loops and curves sense when the system is reinforcing itself toward danger or balancing itself toward calm. They see which interventions strengthen resilience and which feed instability. To think in systems is to recognize that outcomes are not isolated events but expressions of structure and time. The strategist who sees only snapshots reacts; the one who sees loops and curves anticipates.
In business, government or law, this perspective distinguishes discipline from impulse. By mapping relationships through causal loops and understanding their rhythm through logistic growth, leaders learn to read the game as a whole. They act not merely on pieces but on patterns. Systems thinking teaches that the goal of strategy is not control but coherence, a way of seeing that turns complexity into comprehension and motion into meaning.